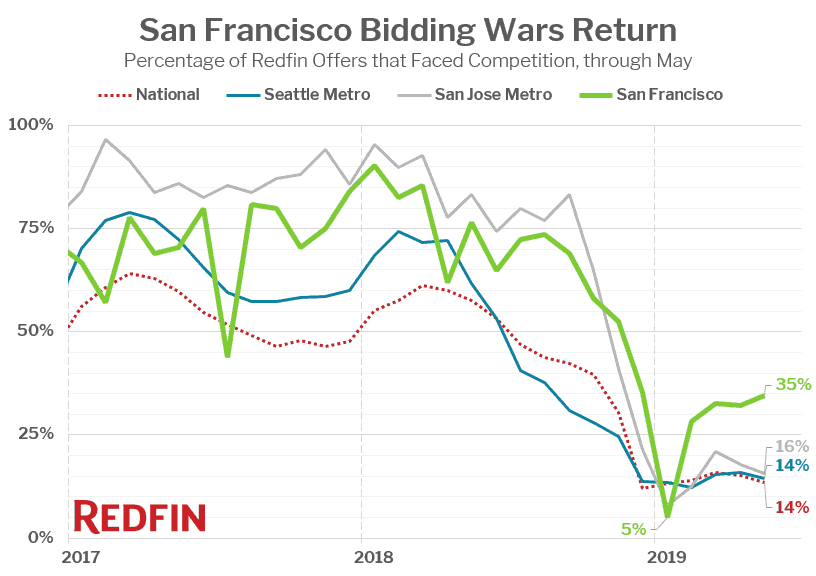
Bidding wars still rare in other previously-hot metro areas
The housing market in San Francisco is quickly heating back up—35 percent of offers written by Redfin agents on behalf of their home-buying customers in May faced a bidding war, up from just 5 percent in January but still down from 77 percent in May 2018. Nationally, just 16 percent of Redfin offers faced a bidding war in May.
“Earlier this year, the San Francisco housing market appeared to be running out of gas, but the recent tech IPOs have reignited competition.” said Redfin chief economist Daryl Fairweather. “Buyers want to get in now before prices shoot up, while many would-be sellers are holding out for higher prices. With more people looking to buy homes than there are homes for sale, what you have is a recipe for bidding wars.”
San Francisco was the most competitive metro in the nation in May, beating out the second-most-competitive metro of San Diego (24%) by over 10 points. No other metro saw more than one in five offers face competition in May.
“Bidding wars are back with a fury in San Francisco,” said local Redfin agent Miriam Westberg. “We’ve seen as many as 33 offers on one property recently, and most offers have no contingencies or are all-cash offers substantially higher than the list price. A few recent buyers have been surprised by how much competition they faced when they submitted their first offer since they heard about the slowdown at the end of last year. But it just takes that one failed offer for most to realize what they are in for. It feels like early spring/summer 2018 again.”

The least competitive market in January was Miami, where just one percent of Redfin offers faced competition. Raleigh (5%) and Dallas (6%) were the second and third-least competitive.
| Metro Area | May 2019 | May 2018 | April 2019 |
|---|---|---|---|
| San Francisco, CA | 35% | 77% | 32% |
| San Diego, CA | 24% | 73% | 19% |
| Boston, MA | 19% | 74% | 18% |
| Austin, TX | 16% | 47% | 14% |
| San Jose, CA | 16% | 83% | 18% |
| Seattle, WA | 14% | 62% | 16% |
| Philadelphia, PA | 14% | 51% | 14% |
| Los Angeles, CA | 13% | 71% | 18% |
| Washington, D.C. | 13% | 53% | 13% |
| Portland, OR | 13% | 43% | 15% |
| Denver, CO | 12% | 57% | 20% |
| Atlanta, GA | 12% | 34% | 6% |
| Houston, TX | 11% | 46% | 7% |
| Phoenix, AZ | 10% | 36% | 19% |
| Chicago, IL | 8% | 36% | 14% |
| Sacramento, CA | 8% | 62% | 13% |
| Dallas, TX | 6% | 59% | 6% |
| Raleigh, NC | 5% | 43% | 4% |
| Miami, FL | 1% | 33% | 5% |
This post first appeared on Redfin.com. To see the original, click here.

