Builders are lowering prices and offering complimentary upgrades and other incentives to lure Dallas-area buyers.
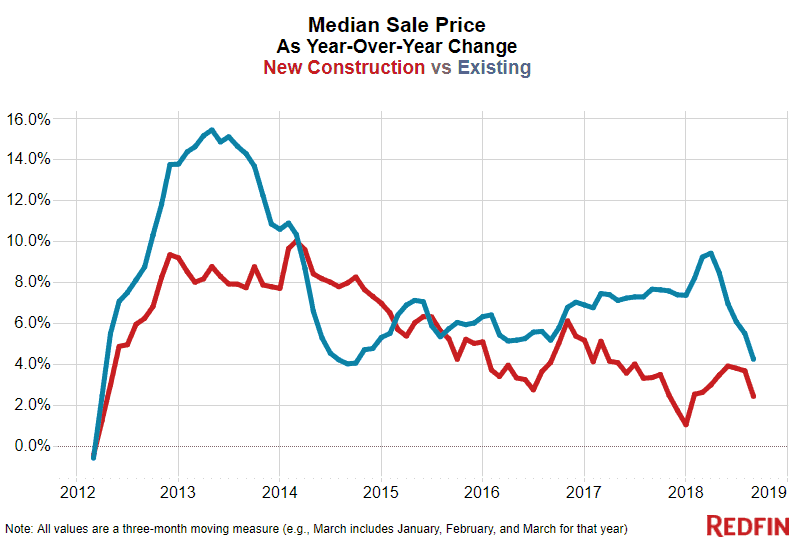
Newly built homes sold for a median of $381,000 in the third quarter, $83,000 more than the typical existing home. Prices of new homes were up 2.4 percent last quarter from a year earlier compared with a 4.2 percent increase for existing homes, based on data from all the metro areas Redfin tracks. Despite the fact that prices for both new and existing homes continued to rise, both grew at a moderating rate as sales flattened and inventory finally began to pick up in the third quarter.

The chill in the market for new homes is in line with housing as a whole as buyers seem to have reached their limit after more than six straight years of annual growth in home prices and mortgage rates reaching their highest averages since 2011.
“Compared with traditional home sellers, builders are often able to adjust more quickly to changing market conditions because they are all business, with levers ready to pull in order to move their inventory and maximize profits,” said Redfin chief economist Daryl Fairweather. “By contrast, homeowners are often driven by emotion and may value their homes based in part on sentiment or how much they need to make on the sale in order to buy their next home. All this can make the realization that you need to drop your price a tougher pill to swallow.”
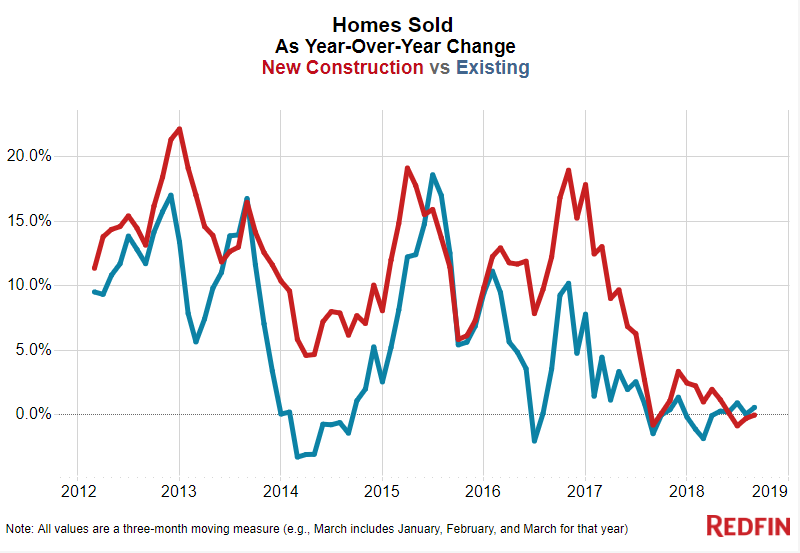
Sales of both new and existing homes were essentially flat year over year in the third quarter. The number of new homes sold dropped just 0.1 percent, while existing home sales increased by 0.5 percent. New construction accounted for 7.7 percent of all homes sold in the third quarter, a share that’s about on par with the level of 7 to 10 percent it has consistently posted since Redfin began collecting the data in 2012.

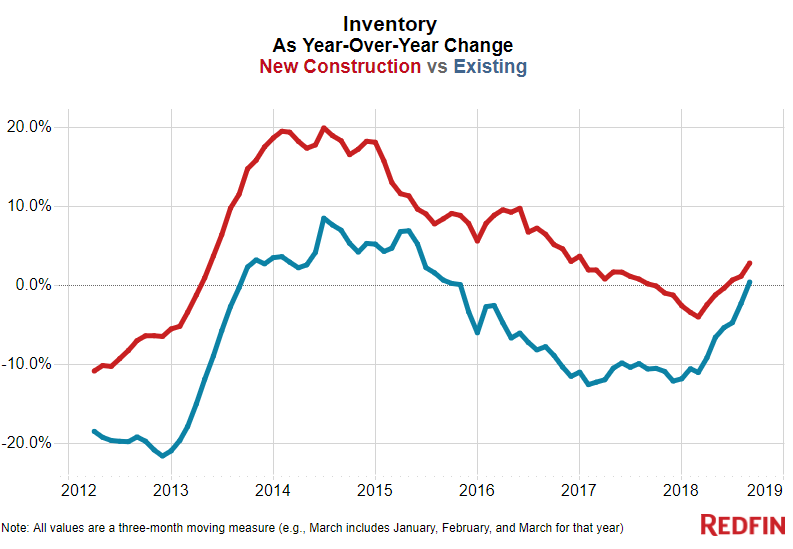
The supply of new-construction homes, which had been falling in the first half of the year, increased 2.8 percent year over year in the third quarter. That’s the biggest annual jump in new construction inventory since January 2017. Existing-home supply crept just above negative territory for the first time since late 2015, posting a 0.4 percent year-over-year increase last quarter compared to the 10.6 percent decrease from the third quarter of 2016 to the third quarter of 2017. It’s worth noting that the inventory growth rates for new and existing homes are trending toward convergence, posting the smallest gap (2.4 points) since at least 2012 when Redfin began tracking these metrics.

One explanation for the rising inventory and slow increase in prices is that buyers in the overall market are reaching their price limit, and because new homes tend to be more expensive, they’re backing off those options first.
Raleigh, North Carolina—where new homes made up a higher share of sales last quarter than in any other market in Redfin’s analysis—is one example of a place where new-home prices are growing out of reach for many prospective buyers. “New construction is even less affordable than it used to be for first-time homebuyers,” said Julie McGee, a Redfin market manager in North Carolina, noting that she started seeing the trend earlier this year.
And well into the fourth quarter, Redfin agents are noticing more new homes on the market, partly because there are typically fewer sales in the fall and winter months. But in some areas, builders are dropping prices and offering incentives for agents and buyers who are showing interest in new construction.
“Although the market is still technically better for sellers, it’s shifting to favor buyers more than it has in years. With more to choose from, buyers focused on new construction are becoming pickier as they look for a good deal,” said Connie Durnal, a Redfin agent in the Dallas area. To attract those buyers, builders are reducing prices—although Durnal pointed out that some prices for new homes were so inflated earlier in 2018 that the drops are simply bringing them down to a reasonable level—and offering financial extras such as closing costs and free design upgrades.
In the Dallas-Fort Worth metro area, the median sale price for a new home in the third quarter was $343,900. Durnal said she has seen builders reduce prices more often in the last three months than ever before in her career, sometimes by up to $50,000.
“They’re offering incentives to get homebuyers to go to them rather than the builder across the street,” Durnal said. “I’ve seen builders offer up to $20,000 in additional upgrade allowance. That’s extra money the buyer can spend at the builder’s design center, upgrading things like countertops and appliances.”
Builders are also offering incentives to agents who bring buyers. In just the past few months, for the first time, Durnal has seen builders offer everything from three-year leases on Mercedes to Super Bowl tickets to Louis Vuitton purses.
For more information on new construction for the third quarter of 2018, Redfin has put together a collection of statistics from the new construction section of its Data Center, which is publicly available.
National new construction trends in the third quarter:
- For new homes, the median price per square foot was $170, an annual increase of 3.4%. The numbers are similar for existing homes, which clocked in at $177 per square foot for a 4.2% increase. (Price per square foot isn’t necessarily a direct comparison for new and existing homes, as new homes are often located in less expensive neighborhoods away from city centers.)
- New listings for new construction was up 1.9% annually. For existing homes, new listings rose by 3.9%.
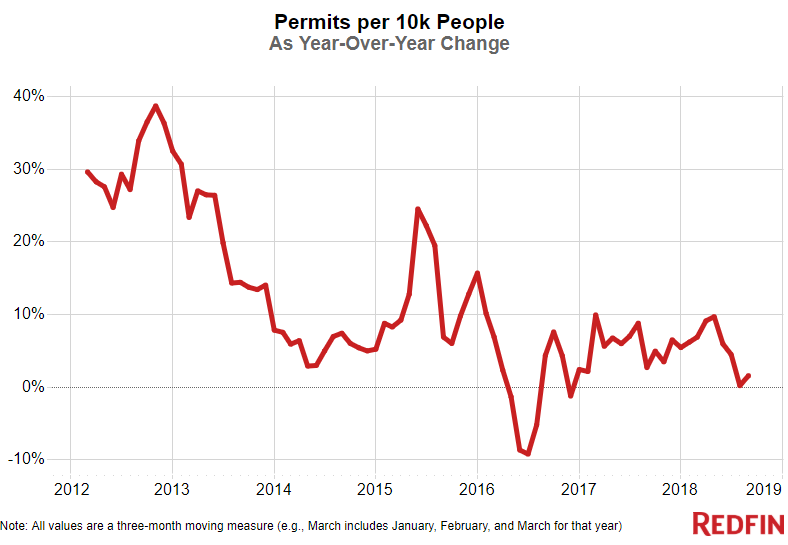
- For all types of residential construction, building permits were up 2.3% annually. For single-family homes, they were up 4.2%. The number of building permits submitted has been on the rise since Redfin started tracking this type of data in the beginning of 2012.
- The rate of building permits per 10,000 people was up 2% year over year.

- New homes were typically on the market for 85 days, down from 94 days the year before. Existing homes were on the market for 35 days, down annually from 38 days.
Metro-level highlights for new construction in the third quarter:
- In Raleigh, NC, 27% of all homes sold were new construction, the highest share of any metro area in the country. That’s followed by Nashville, where 24% of homes sold were new, and Austin, which clocks in at 21%. The top 14 areas for this metric are all in the South.
- New Jersey, New York and California are on the other end of the spectrum. Camden, NJ had the smallest portion of new construction among all homes sold, at just 1.2%, followed closely by Buffalo, NY at 1.3%, and Rochester, NY at 1.6%. In California, five areas (San Jose, Oakland, San Diego, Orange County and Ventura County) rank in the bottom 11.
- The rate in building permits declined in a majority of markets year over year. Honolulu, Little Rock and Milwaukee experienced the largest drops, coming in at 68.3%, 67.7% and 67.1%, respectively.
- Not all markets are seeing a drop in building permits. In Fort Myers, FL, building permits were up significantly more than any other metro area on an annual basis, with a 94.3% jump, followed by San Jose (46.8%) and Tucson (45.3%).
- The metro areas with the biggest year-over-year increase in price per square foot for new construction are San Jose (35.8%) and Las Vegas (22.4%), followed by San Francisco (20.3%) and Rochester, NY (19.1%).
- Honolulu saw the most significant drop in price per square foot for new construction, declining by 22.2%. Pittsburgh comes in second with an 8.1% decline, followed by Hudson Valley, NY, with a 6.3% drop.
For a closer look, Redfin is making available a downloadable set of monthly data on new construction prices, sales, inventory and other new residential market statistics. The dataset goes back to 2012.
This post first appeared on Redfin.com. To see the original, click here.
