Sale prices for homes in the top 5% of the market fell for the first time in nearly three years. But in some cities, the luxury market strengthened.
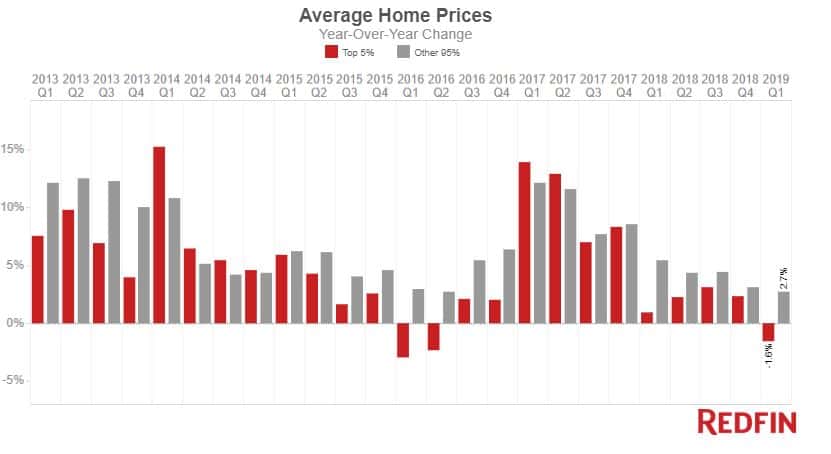
The average sale price for luxury homes nationwide fell 1.6 percent to $1.55 million in the first quarter of 2019, the first annual decline in nearly three years.

For this analysis, Redfin tracks home sales in more than 1,000 cities across the U.S. (not including New York City) and defines a home as luxury if it’s among the 5 percent most expensive homes sold in the quarter. In the other 95 percent of the market, home prices rose 2.7 percent year over year to an average of $300,000 in the first quarter, following six straight years of increases.
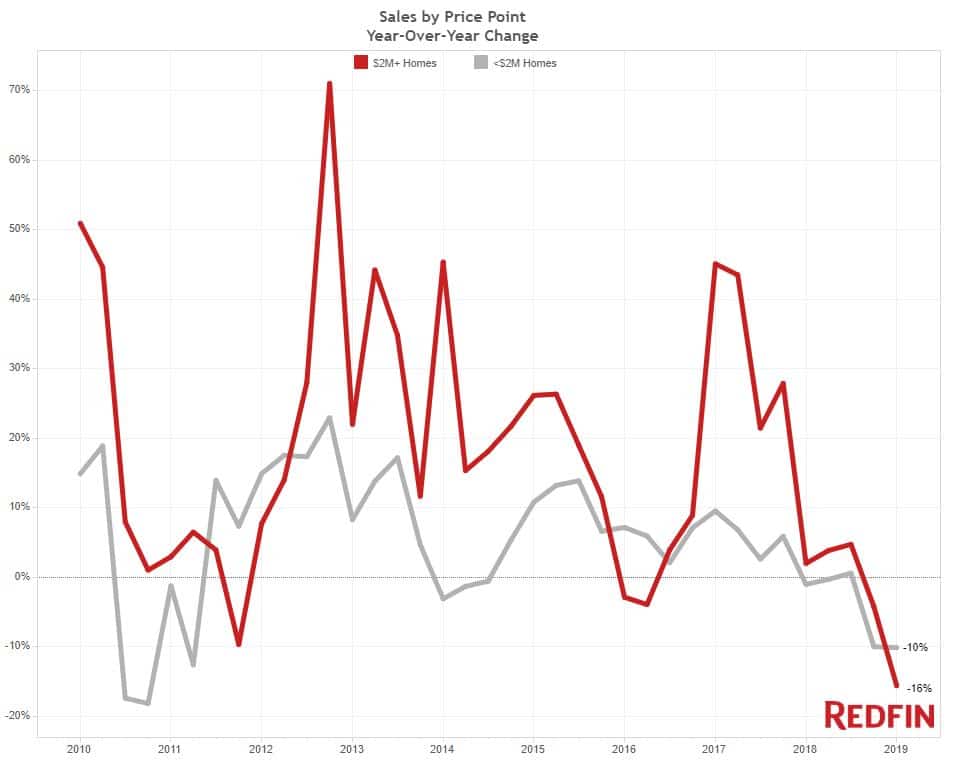
Sales of homes priced at or above $2 million fell 16 percent year over year last quarter, marking the second consecutive quarter of declining sales and the biggest luxury sales decline since 2010.

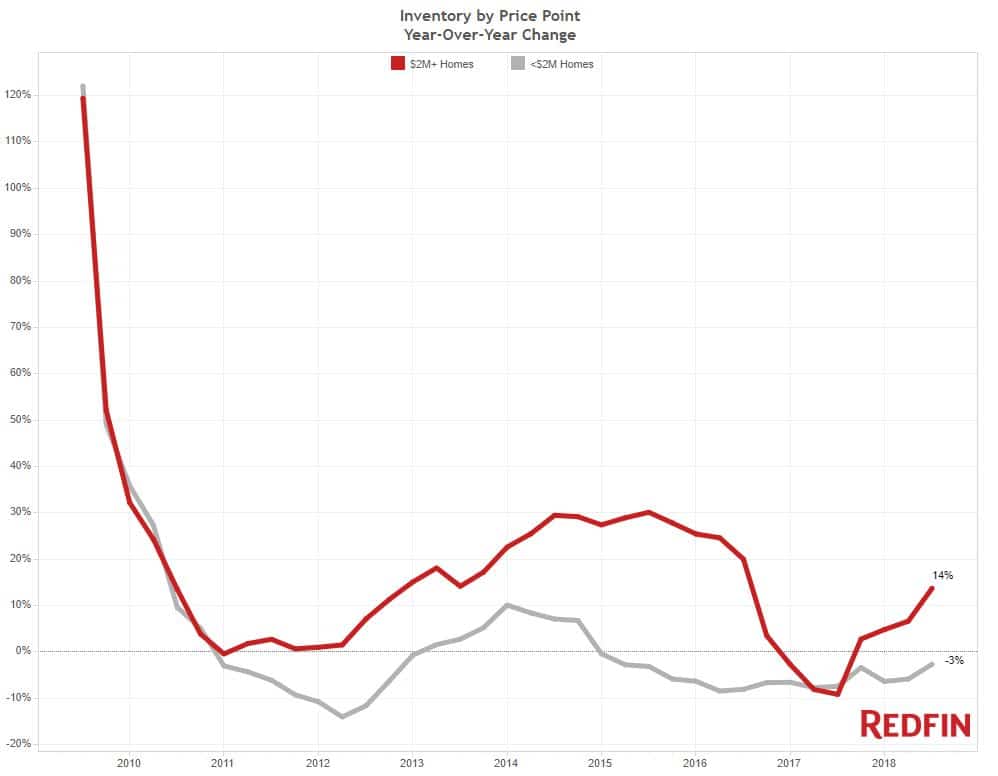
The supply of homes priced at $2 million or above increased 14 percent annually in the first quarter, the fourth quarter in a row of increases.

The fact that prices and sales are falling while supply has been growing suggests that demand for luxury homes is down from last year. While the stock market’s shaky performance over the past six months could play a role in hindering demand for high-priced homes, tax reform measures that lowered the limits on deductions for mortgage interest and state and local taxes are largely to blame.
“Because homeowners can’t deduct as much mortgage interest as they used to be able to, the calculus has changed when it comes to buying a home, especially an expensive one,” said Redfin chief economist Daryl Fairweather. “Although the new mortgage rule applies to everyone in the country, high earners in states with high income taxes like California and Massachusetts saw their tax bills surge. Not only do the new rules make it less desirable to purchase a multi-million dollar home in high-tax states, it has also motivated some people—especially those with big incomes and big housing budgets—to consider moving to places like Florida, Washington or Nevada, which have no state income tax.”
| Q1 2019 market summary | Luxury market (top 5%) | Rest of market (bottom 95%) |
| Average sale price | $1,546,000 | $300,000 |
| Average sale price YoY | -1.6% | 2.7% |
| Average days on market | 83 | 69 |
| Days on market YoY | -3 | -10 |
| Percent of homes that sold above list price | 1% | 18% |
Despite the overall decline, luxury home prices fell in just one-third of cities in this analysis. To understand the forces that drove the price and sales declines in the luxury market last quarter, let’s examine the major cities in the metro areas where most of the luxury sales in our analysis take place.
| City | Average Luxury Sale Price in Q1 2019 | YoY Change in Luxury Sale Price | YoY Change in Sales of $2 Million + Homes |
| Boston, MA | $3,219,000 | -22.4% | -10% |
| Newport Beach, CA | $7,910,000 | -21.8% | -33.3% |
| Miami, FL | $1,627,000 | -19.3% | -12.9% |
| San Jose, CA | $2,348,000 | -2.7% | -6.7% |
| San Diego, CA | $2,516,000 | -1.4% | -8.3% |
| San Francisco, CA | $4,936,000 | -0.3% | -10% |
| Los Angeles, CA | $4,773,000 | 0.6% | -17.9% |
| Naples, FL | $4,159,000 | 5.3% | -9.1% |
| Seattle, WA | $2,307,000 | 6.4% | 0% |
| West Palm Beach, FL | $2,851,000 | 89.6% | -23.1% |
Among those 10 luxury-market driving areas, the city of Boston recorded the biggest year-over-year price drop in the first quarter (-22.4%), the fourth consecutive quarter of luxury price declines. In Newport Beach (-21.8%), Miami (-19.3%), San Jose (-2.7%) and San Francisco (-0.3%), last quarter marked the second consecutive quarter of luxury price declines.
In San Diego, where prices fell 1.4 percent, this was the first quarter of declining luxury home prices in two years. Of the six places included in the list above where luxury home prices fell in the first quarter, San Diego is the only one where prices rose the quarter before.
Nine of the 10 markets listed above drove the national sales drop in the first quarter, with West Palm Beach posting a 23.1 percent decline in the number of luxury homes sold and Los Angeles posting a 17.9 percent decrease. Of the cities corresponding to the 10 metros that make up more than half of national luxury sales, only Seattle didn’t post a year-over-year decline in sales, but it didn’t see an increase, either.
Biggest price gains
Luxury prices may be down nationwide, but they’re rising in some cities. For the fourth quarter in a row, West Palm Beach saw the biggest increase in prices for homes in the top 5 percent of the market, up 89.6 percent year over year to more than $2.8 million last quarter. Next up is another city in Florida, St. Petersburg, where sale prices were up 62.3 percent annually to nearly $2 million.
Florida cities typically appear on the list of places where luxury home prices increase, but this quarter there are also some areas less well known for their luxury markets. For instance, in Charleston, South Carolina, luxury prices were up 42.3 percent annually to $2.3 million. In Boise, Idaho, prices rose 17.2 percent annually to $1 million.
“Home prices in Boise are going up at all price points, especially in the luxury market,” said Paul Reid, the Redfin market manager in Boise. “We are helping a lot of homebuyers move here from Seattle, Southern California, Denver and the Bay Area. Many plan to work remotely, bringing their big-city salaries to Boise. These buyers can afford high-priced homes, and what they get for their money is substantially nicer than what they could buy for the same amount of money in the cities they’re coming from.”
Here’s a look at the top 10 cities where luxury home prices rose the most in the first quarter of 2019:
| Luxury market (top 5%) | Rest of market (bottom 95%) | |||
| City | Average sale price | YoY change | Average sale price | YoY change |
| West Palm Beach, FL | $2,851,000 | 89.6% | $226,000 | 3.7% |
| St. Petersburg, FL | $1,986,000 | 62.3% | $313,000 | 36.7% |
| Charleston, SC | $2,353,000 | 42.3% | $363,000 | 3.4% |
| Tacoma, WA | $1,017,000 | 33.1% | $327,000 | 11.2% |
| Fort Lauderdale, FL | $3,077,000 | 27.8% | $403,000 | 0.8% |
| Henderson, NV | $1,417,000 | 27% | $327,000 | 5.8% |
| Birmingham, AL | $1,109,000 | 22.4% | $230,000 | 4.1% |
| Boise, ID | $1,002,000 | 17.2% | $323,000 | 10.6% |
| Boca Raton, FL | $3,418,000 | 15.3% | $363,000 | 4.9% |
| Atlanta, GA | $1,685,000 | 14.9% | $330,000 | 8.6% |
Luxury homes selling 3 days quicker than last year
Although prices and number of sales for luxury homes are down, they’re selling slightly faster. In the first quarter of this year, the typical luxury home that sold went under contract in 83 days, down slightly from 86 days a year earlier. The typical non-luxury home that sold in the first quarter went under contract in 69 days, down from 79 days in the first quarter of 2018.
Luxury homes sold fastest in San Jose, where they spent an average of 22 days on the market before going under contract, compared with 35 days a year earlier. Next comes San Francisco, where luxury homes took 53 days to go under contract, down from 57 days in the first quarter of 2018 and Los Angeles (61 days, down from 67 days a year earlier).
Most expensive sales
What’s the next best thing to owning an 8-acre, $27 million estate in the hills of Santa Barbara? Looking at pictures of it on Redfin.com. Here’s a look at the 10 most expensive homes that sold in the first quarter of 2019:
- This 8-bedroom, 8.5-bathroom Lake Tahoe estate sold in January for $37 million, a price tag that makes it the most expensive sale of the first quarter. The home, which comes with a private pier and more than 400 feet of lakefront property, has hosted events like the Oscar de la Renta Fashion Show and the Lake Tahoe Summer Music Festival.
- This 1.5-acre Bel Air property is a bona fide compound, with a 5-bedroom, 5.5-bathroom main house and a 2-bedroom, 2.5-bathroom guest house. And no self-respecting compound would be complete without the “finest views in Los Angeles.” It sold for $29 million in January.
- Take a look at this 8-acre retreat in Montecito, California, located just south of Santa Barbara, which sold for $27 million. The 5-bedroom, 10-bathroom home features “luxurious Balinese & Asian-influenced design,” ocean views, a pool and cabana and, of course, a guest house.
- It’s somebody’s lucky day: This Bel Air lot, which sold for $26.5 million in March, is back on the market for $32 million. The 1.2-acre property, which features panoramic views of the Pacific Ocean and Los Angeles, has plans approved to start construction on someone’s dream home.
- We’re traveling away from California to take a look at this 7-bedroom, 7.5-bathroom estate, one of 34 homes on Star Island in Miami. The home, which sold for $25 million, sits on the waterfront of Biscayne Bay, and it comes complete with a pool and tennis court.
- Located on Palm Island in Miami, this 9-bedroom, 10.5-bathroom home features a theater, wine cellar, infinity pool and double-height ceilings. It sold for $24.6 million.
- The tour of Florida continues: This 4-bedroom, 5.5-bathroom luxury condo in West Palm Beach sold for $24.6 million. The penthouse unit features unobstructed views, an expansive balcony, and building amenities including pool, salon and spa.
- Construction on this 12,494-square-foot home, located on an acre in Atherton, California, was completed earlier this year and sold for $23.1 million. The home has seven bedrooms and 9.5 bathrooms, plus a gourmet kitchen, home theater, exercise studio, fire pit, pool…. And the list goes on.
- Located in Beverly Hills, this castle-like property features 17,000 square feet of living space, including a main house and a guest residence. The home’s “artisan quality finishes are highlighted by soaring 30-foot ceilings, hand-painted murals and Italian stone floors.” It sold for $23 million.
- In Naples, Florida, this southern-style estate sold for $22.5 million. The home sits on more than two and a half acres, with 150 feet of beachfront on the Gulf of Mexico. The property also comes with not one but two guest houses.
And for a look at luxury homes priced at $1.5 million to $2 million, check out our roundup of what kind of home you can get within that range around the country.
METHODOLOGY
Redfin tracks the most expensive five percent of homes sold in more than 1,000 U.S. cities and compares price changes to the bottom 95 percent of homes in those cities. Analysis is based on multiple-listing and county recorder sales data in markets served by Redfin. To determine cities with the biggest year-over-year price increases, we looked at cities with at least 45 luxury sales in the quarter and an average luxury sale price of $1 million or higher. For inventory and sales, Redfin looked at homes priced at or above $2 million that were sold in the first quarter of 2019.
This post first appeared on Redfin.com. To see the original, click here.

